 By Chance Shay, Communications Strategist
In 2015 it’s impossible to browse a news site, scroll through your social media stream or learn about an innovative product without coming across an infographic and there’s good reason for that.
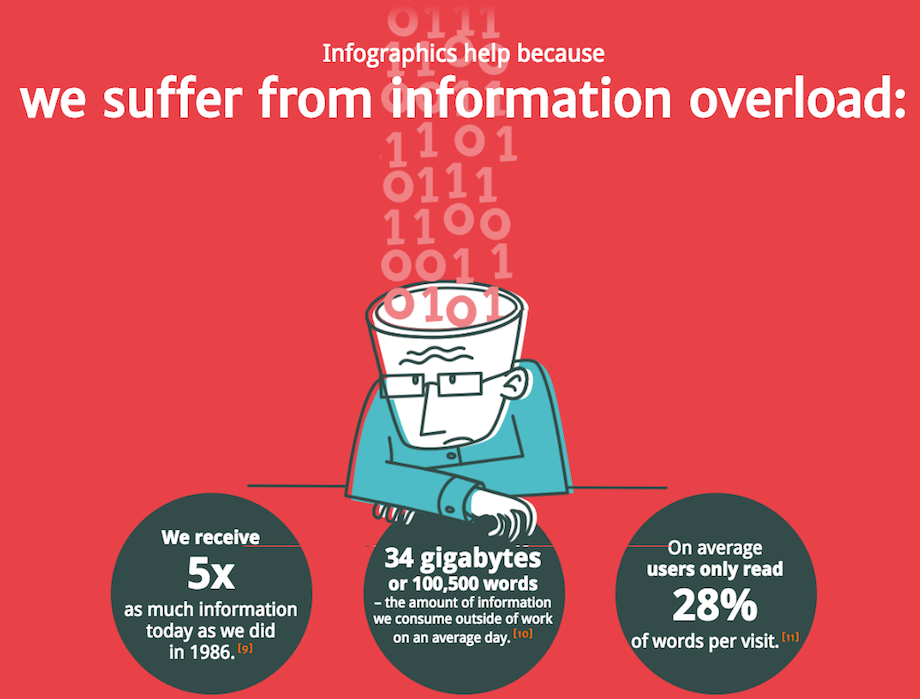
Humans are consuming more information than ever before. In fact, in 2008 Americans consumed about 1.3 trillion hours of information outside of work. This works out to an average of nearly 12 hours per person per day, which means most American’s are constantly consuming information other than when they sleep.
With so much information coming at a person each day, how does a brand communicate in a way that gives itself the best chance at having its information capture the attention of current and prospective customers?
Visually.
In addition to allowing information to be consumed easier, infographics lend themselves perfectly to the modern culture of social sharing. The cool designs, fun visuals and interesting kernels of data make infographics the perfect content to share with Twitter followers, muse about on YouTube channel,s up-vote on Reddit or even write a blog about (this blog about infographics being good for blogs = blogception).
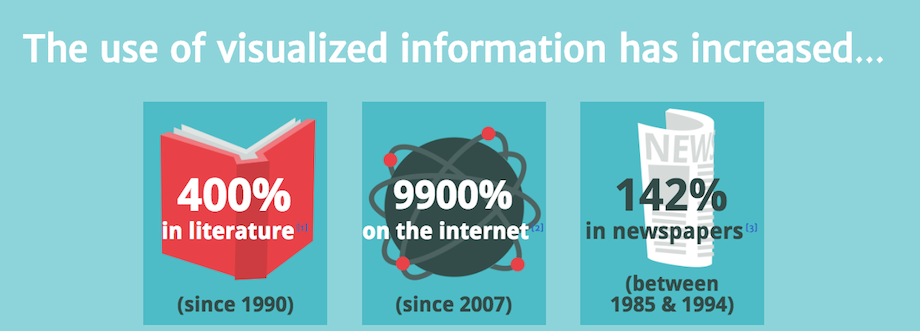
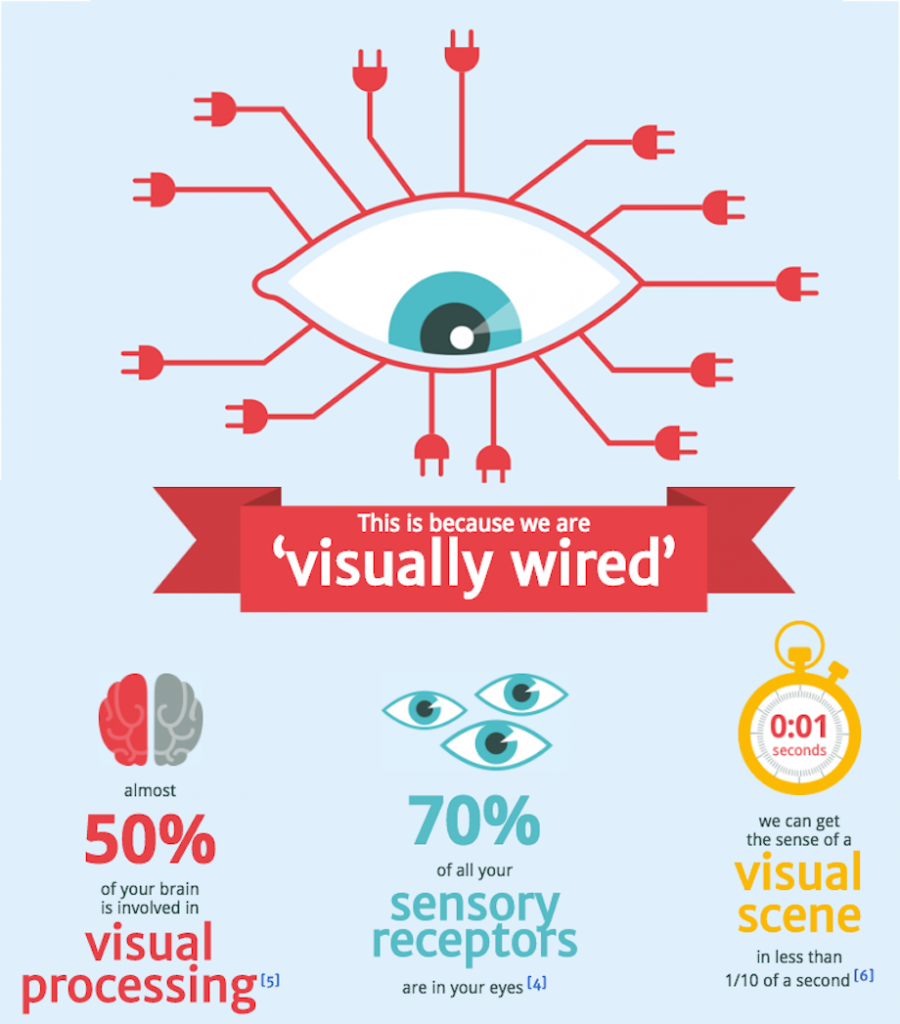
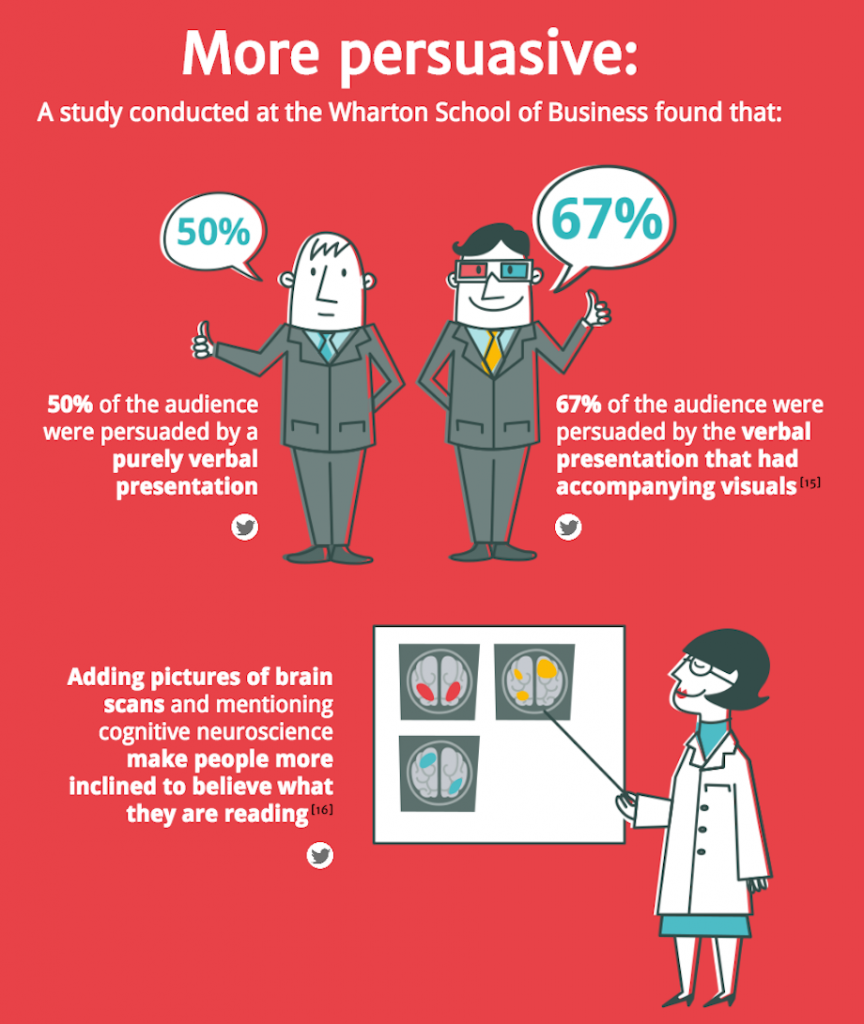
But enough words, we’ll let the visuals do the talking. The good folks at NeoMam Studios put together an awesome interactive infographic webpage (we LOVE HTML5 too!) illustrating thirteen reasons why your brain craves infographics. Some of those images are below, but visit their webpage for the full list.
And remember the golden rule: if you can communicate your message visually, do it.
Check out our related posts below:
Solution-Based Web Tools For Every PR Pro
Your Competitive Advantage is Being Human






 Grant Wright

 Corie Fiebiger
 Shae Geary
 Phelan Riessen
 Katrina Early
 Hamish Marshall
1 Comment
[…] are able to learn up to 400% better when you integrate visuals like infographics, visuals are 67% more persuasive than words alone, and visuals trigger the emotional centers of the brain better than the other […]